Highlights
- Studying CD4+ T cell heterogeneity, plasticity and differentiation by combining modeling and experimentation.
- Building multiscale modeling platforms and models driven by high-performance computing
- Characterizing how innate immune responses modulate adaptive immunity in the context of enteric pathogen infection.
- Developing predictive, validated computational models of immune responses during IBD
- Building a synthetic human mucosal immune system
- More information about NIMML’s Computational Immunology efforts can be found at modelingimmunity.org
Ongoing Efforts

Computational modeling uses computer simulation of mathematical models to study the behavior of complex systems. NIMML uses computational models in combination with pre-clinical and clinical immunology experimentation to understand the dynamics of immunological networks leading to the characterization of novel mechanisms of immune modulation.
Computational immunology or immunoinformatics encompasses applying computational modeling, genomics, and bioinformatics approaches to study immunological processes at the systems level. NIMML and MIEP apply abductive reasoning to investigate novel immunological mechanisms and identify unforeseen therapeutic targets in the context of human diseases.
Publications
Model of colonic inflammation: immune modulatory mechanisms in inflammatory bowel disease
ENteric Immunity SImulator: a tool for in silico study of gastroenteric infections
ENISI Visual, an Agent-based Simulator for Modeling Gut Immunity
ENISI SDE: A novel web-based stochastic modeling tool for computational biology
ENteric Immunity SImulator: a tool for in silico study of gastroenteric infections
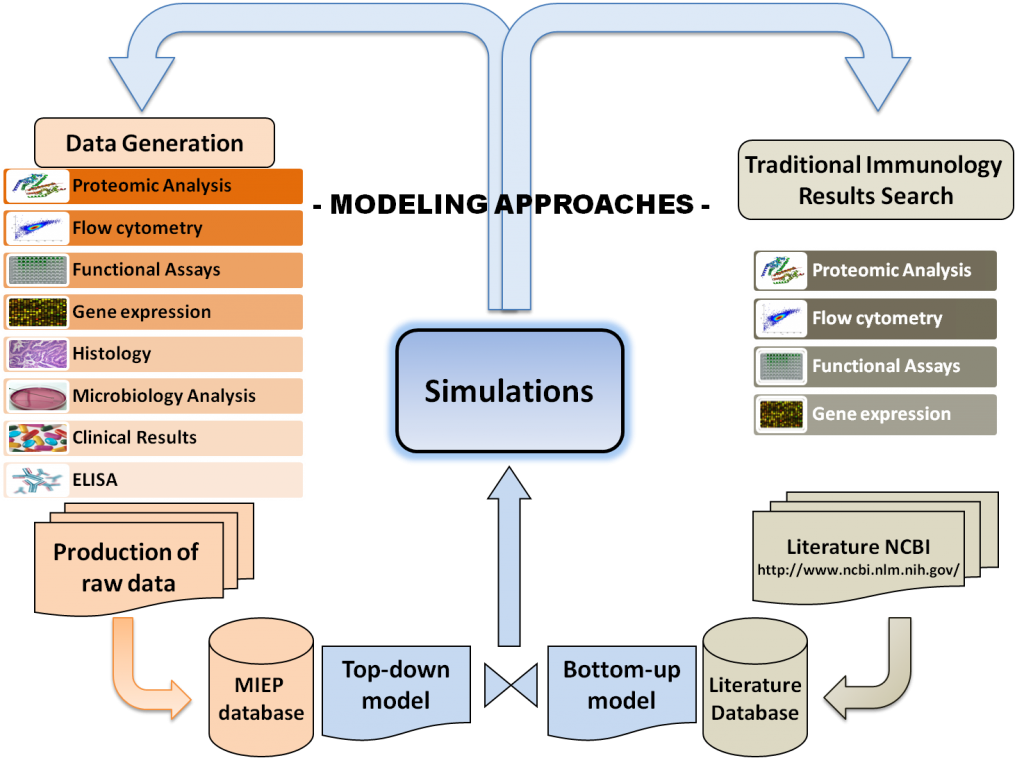 Modeling Approaches
Highlights
- Generation of the structural model based on a literature search
- Compilation of a calibration database using literature data sets
- Model fitting to the experimental data via a calibration process
- In silico experimentation to generate model-derived predictions
- Validation of model-derived predictions through experimental testing
- Model refinement by feeding newly generated experimental data back to the model
- Generation of novel hypotheses
About
Computational and Mathematical modeling approaches cannot replace traditional experimentation; however, they can be used to synthesize, organize and integrate diverse datatypes and theoretical frameworks to help generate new knowledge and target in vivo experimentation. Indeed, computer simulations of immunological processes can predict novel experimental behaviors, correlations and interactions between components of a complex system such as the signaling pathways controlling differentiation and function of Th cells, cellular interactions of different subsets during infection, or cellular populations forming specific lesions in tissues.
NIMML will also provide immunologists and infectious disease experts novel ways to study the immune system by making computational solutions easily accessible and user-friendly. NIMML will make computational resources seamless, invisible for routine analytical efforts and organize them as an evolving commodity that serves the immunology and infectious disease communities.
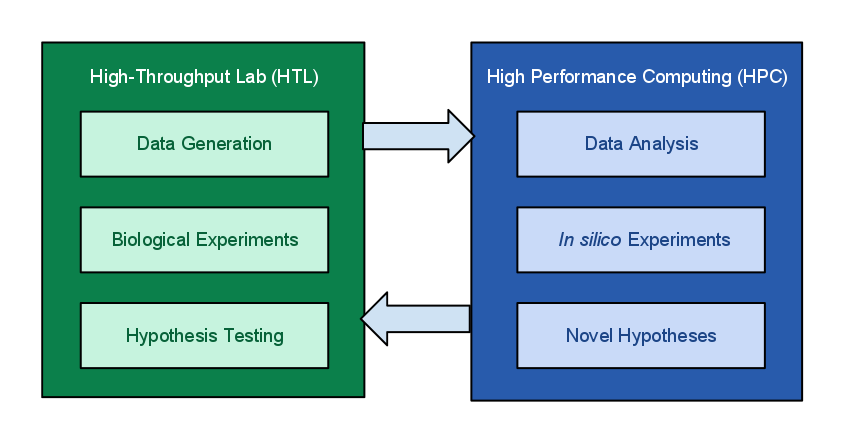 Figure 1.
Highlights
- Shadowfax, a hybrid cluster with 912 processor cores, 5.4 TB of RAM, 40Gb/s InfiniBand network, 80TB parallel storage, 16 nVidia Tesla GPGPUs (7168 CUDA cores) and 3 FPGA based Convey HC-1 systems
- ENISI agent-based models run in Shadowfax and can scale up to 10^8 cells
- Condor Copasi runs in Shadowfax and performs task such as parameter estimation and parameter scanning in parallel
- RNA seq analysis with Galaxy local instance installed on Shadowfax
Ongoing Efforts
The MIEP program of NIMML focuses on modeling and simulation of immune responses for enteric pathogens and runs large numbers of in silico experiments. Due to the high complexity of the immune responses, modeling these processes and running in silico experiments depends highly on availability of robust computing resources. For example, a COPASI CD4+ T cell differentiation model can take more than one week to fully estimate parameters. In addition, an ENISI in silico experiment with more than 1 million cells could take more than 20 hours to run. The hypotheses generated from the in silico experiments will be validated through biological experiments in the laboratory. The high-throughput data obtained from the biological experiments requires HPC for processing, analyses and visualization. Ultimately this integrated effort will help identify potential therapeutic targets and novel disease biomarkers.
Current resources at the Core Computational Facility (CCF) at the Virginia Bioinformatics Institute (VBI) encompass more than 7.4 TB of RAM, 1860 processor cores distributed across 250 servers and clusters, and close to 4.3 PB of storage, including 20 nodes in the cluster purchased by the MIEP program, with a total of 240 cores and 960 GB of main memory. The centers host a storage area network ensuring high-speed data access and reliability. The largest system is Shadowfax, which is optimized for HPC in the life and medical sciences, a hybrid cluster with 912 processor cores, 5.4 TB of RAM, 40Gb/s InfiniBand network, 80TB parallel storage, 16 nVidia Tesla GPGPUs (7168 CUDA cores) and 3 FPGA based Convey HC-1 systems. Off-site data backup and recovery procedures prevent data loss in case of a disaster. The CCF provides the technical infrastructure for experimental data storage (high-throughput reporter assays, flow cytometry, transcriptomics sequencing, proteomics, ChipSeq). The live stats for resource usages of our data center can be monitored here.
Data Figures
 Figure 2.
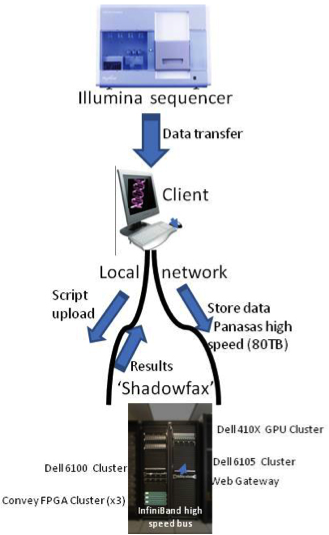 Figure 1. RNA-Seq workflow
Highlights
- Development of an integrated pipeline for analysis of RNA-seq and microarray datasets, network inference and construction of mathematical and computational models.
- Application of RNA-seq data analyses for the discovery of new therapeutic targets for infectious, chronic and immune-mediated diseases.
- Combining theoretical and data-driven modeling efforts by using high-dimensional RNA-seq datasets.
- Development of new data modeling visualization tools spanning across spatiotemporal scales.
Transcriptome Sequencing (RNA-Seq)
To survey global transcript profiles, we will use a RNA-Seq pipeline based on Myrna 1 and customized Perl scripts. We will heavily use the computational infrastructure hosted at the Core Computational Facility at VBI for data analysis. An example of a supercomputer we will use is “Shadowfax”, which is a 240-core (Intel) computer cluster and has 64-bit, 960 GB of main memory, and 80TB of shared Panasas PAS7 disk space, which is owned in part by the NIMML. RNA-Seq provides greater resolution than expression microarrays and enables detection of new coding and non-coding transcripts, as well as splicing variants. The pipeline integrates short read alignment (Bowtie) with interval calculations, normalization, aggregation and statistical modeling. A minimal set of genomic intervals will be calculated such that all bases covered by the interval set are covered by all annotated gene transcripts. Reads will be aligned with Bowtie using quality scores and requiring that only reads with a single best alignment are retained. The sensitivity of RNA-Seq is a function of both molar concentration and transcript length. Hence, we will quantify transcript levels in reads per kilobase of exon per million mapped reads (RPKM-normalized, http://seqanswers.com/forums/showthread.php?t=586). The RPKM measure reflects the molar concentration of a transcript in the starting sample by normalizing for RNA length and for the total read number in the measurement 2. To test for differential expression, we will use moderated t-test with the Benjamini-Hochberg correction for False Discovery Rate (FDR). Gene Ontology will be analyzed with goseq R Bioconductor package [www.bioconductor.org] that is also integrated with KEGG pathway analysis. The most significant gene up- and down-regulations will be validated with independent biological sampling and taqman qRT-PCR assays. Synthetically ‘artificial’ RNAs will be generated (IDT-DNA) and spiked into RNA samples as internal normalizers before quantification.
ChIP-seq analysis
Chromatin immunoprecipitation (ChIP) is a powerful technique to identify direct target genes via isolating DNA fragments bound by proteins followed by high-throughput sequencing. Illumina’s ChIP-seq protocol will be used for determining the genomic binding locations of transcription factors and changes associated with infection. Antibodies will be tested for their specificity and immunoprecipitation efficiency prior to CHiP. A typical ChIP-seq experiment delivers hundreds to tens of thousands of predicted locations (‘ChIP-seq peaks’) with resolution of ~50 bp of the predicted location 3. A single PC platform will be used to support seqMINER that integrates multiple ChIP-seq datasets as well as analysis and visualization modules, including estimates of tag densities over reference loci, enrichments, normalizations, and heatmaps 4. The peak-calling algorithm will be run on successively smaller random subsets of the set of sequence reads and the number of detected peaks will be plotted against the number of reads to test whether a library has reached a saturation point beyond which no new binding sites are identified. The empirical FDR will be estimated for each detected peak adopting methods from ChIP-chip 5.
Analysis of microRNAs (miRNA-seq)
In the last decade, microRNAs (miRNAs) have emerged as a new level of genome regulation in eukaryotes 6. miRNAs are short (19-24 nucleotides) noncoding RNAs that are processed from longer primary-miRNA transcripts. Mature miRNAs are incorporated into the RNA-induced silencing complex (RISC) where they typically recognize and bind to sequences in the 3’ untranslated regions (3’UTRs), leading to suppression of translation and/or degradation of mRNA. miRNAs are endogenous and are often coded by sequences located in intronic regions of the protein coding gene that they regulate. They can also be transcribed from intergenic regions, in which case their transcription is not directly coupled with the gene(s) they regulate. Although often associated with knock-down, as opposed to knock-out, miRNAs can also be involved in the upregulation of the genes they affect 7. Overall, miRNAs are involved in the regulation of at least one-third of the human genome and contribute to many, biological processes, including growth, differentiation, development and energy metabolism 6. There is accumulating evidence that miRNA play a critical role in immunity and inflammation. For example, such miRNAs as miR-146a and miR-155 are involved in the regulation of T- and B-cell development 8, differentiation and function 9. Misregulated miR-146a and miR-155 have been associated with various autoimmune diseases including SLE, RA, and MS. Distinct miRNA expression profiles have been found in Crohn’s disease (CD) and ulcerative colitis 10.
Next-generation sequencing allows the sequencing of miRNA molecules and simultaneous quantification of their expression levels. A GeneSifter 11 pipeline will be used to identify and quantify components of the sample, including miRNAs (employing miRBase v. 15) and piRNA (employing RNAdb 12). All reads are mapped against the mouse reference genome. To determine putative gene targets of miRNA, the EMBL-EBI Microcosm v5 database will be used. Additionally, precursor and mature sequences will be retrieved from MirBase v16 13 and entered into microRNAminer 14. Once each sample’s miRNA expression profile is characterized, pair-wise analysis between infected and control samples are conducted to identify the most differentially expressed miRNA. These likelihood ratio tests are conducted on log-transformed data that were normalized against the total number of reads per sample. TaqMan quantitative RT-PCR assays (Life technologies) will be used to validate differential representation of all candidate miRNAs, with synthetic spike-in RNAs as internal normalizers.
Publications
1. Langmead B, Trapnell C, Pop M, Salzberg SL. Ultrafast and memory-efficient alignment of short DNA sequences to the human genome. Genome Biol 2009;10:R25. [PubMED]
2. Wold B, Mortazavi A, Williams BA, Mccue K, Schaeffer L. Mapping and quantifying mammalian transcriptomes by RNA-Seq. Nature Methods 2008;5:621-628. [PubMED]
3. Wilbanks EG, Facciotti MT. Evaluation of algorithm performance in ChIP-seq peak detection. PLoS One 2010;5:e11471. [PubMED]
4. Ye T, Krebs AR, Choukrallah MA, Keime C, Plewniak F, Davidson I, Tora L. seqMINER: an integrated ChIP-seq data interpretation platform. Nucleic Acids Res 2011;39:e35. [PubMED]
5. Johnson WE, Li W, Meyer CA, Gottardo R, Carroll JS, Brown M, Liu XS. Model-based analysis of tiling-arrays for ChIP-chip. Proc Natl Acad Sci U S A 2006;103:12457-62. [PubMED]
6. Lewis BP, Burge CB, Bartel DP. Conserved seed pairing, often flanked by adenosines, indicates that thousands of human genes are microRNA targets. Cell 2005;120:15-20. [PubMED]
7. Vasudevan S, Tong YC, Steitz JA. Switching from repression to activation: MicroRNAs can up-regulate translation. Science 2007;318:1931-1934. [PubMED]
8. Chen CZ, Li L, Lodish HF, Bartel DP. MicroRNAs modulate hematopoietic lineage differentiation. Science 2004;303:83-6. [PubMED]
9. Sonkoly E, Stahle M, Pivarcsi A. MicroRNAs and immunity: novel players in the regulation of normal immune function and inflammation. Semin Cancer Biol 2008;18:131-40. [PubMED]
10. Dalal SR, Kwon JH. The Role of MicroRNA in Inflammatory Bowel Disease. Gastroenterol Hepatol (N Y) 2010;6:714-22. [PubMED]
11. Geospiza. GenesSifter Analysis Edition. In: Geospiza, ed. Seattle, WA: Geospiza, 2011. [website]
12. Pang KC, Stephen S, Engstrom PG, Tajul-Arifin K, Chen W, Wahlestedt C, Lenhard B, Hayashizaki Y, Mattick JS. RNAdb–a comprehensive mammalian noncoding RNA database. Nucleic Acids Res 2005;33:D125-30. [PubMED]
13. Griffiths-Jones S, Saini HK, van Dongen S, Enright AJ. miRBase: tools for microRNA genomics. Nucleic Acids Res 2008;36:D154-8. [PubMED]
14. Artzi S, Kiezun A, Shomron N. miRNAminer: a tool for homologous microRNA gene search. BMC Bioinformatics 2008;9:39. [PubMED]
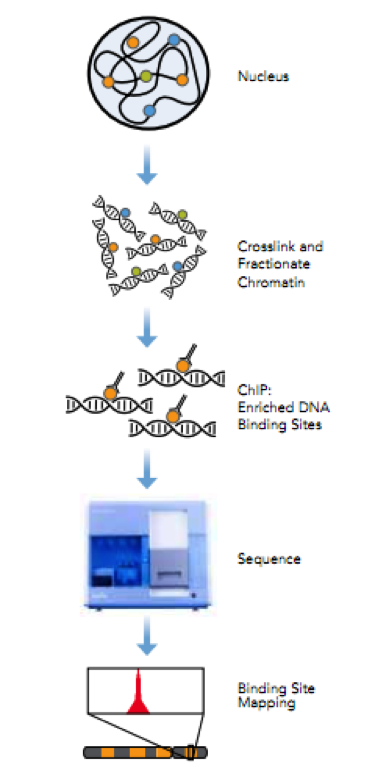 Figure 2. ChIP-Seq workflow
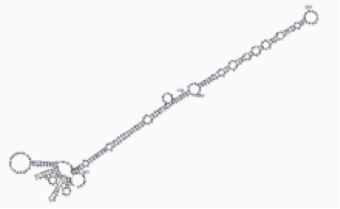 Figure 3. Example of stem-loop secondary structure of a pre-microRNA.